Generating Graphs Using the XGraph Class

The XGraph class provides an interface to the 2D plotting functions of MLDesigner. The 2D plotting system and all plotting options are documented in Visualization Using 2D Plotting System.

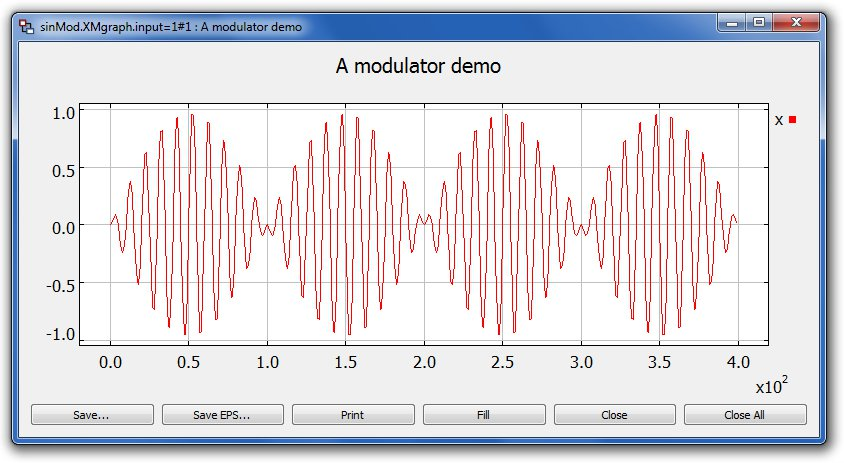
Example of output of the plotting system using the XGraph class

The most useful methods of the class are summarized in the table below. Using the XGraph class involves an invocation of the initialize method, some number of invocations of the addPoint method, followed by an invocation of the terminate method. Multiple data sets (currently up to 64) may be plotted together. They will each be given a distinctive color and/or line pattern. Within each data set, it is possible to break the connecting lines between points by calling the newTrace method.

Class XGraph

Method

Parameter

Description

void initialize (...)


start a new plot


Block* parent

pointer to the block using the class


int noGraphs

the number of data sets to plot


const char* options

options to pass to the plotting system


const char* title

title to put on the graph


const char* saveFile = 0

name of a file to save data to


int ignore = 0

number of initial points to ignore

void addPoint (...)


add the next point to the first data set with implicit x position


float y

the vertical position

void addPoint (...)


add a single point to the first data set


float x

the horizontal position of the point to plot


float y

the vertical position of the point to plot

void addPoint (...)


add a single point to a particular data set


int dataSet

the number of the data set (starting with 1)


float x

the horizontal position of the point to plot


float y

the vertical position of the point to plot

void newTrace (...)


start a new trace independent from the previous trace


int dataSet = 1

the data set for the new trace

void terminate ()


plot the data using the 2D plotting system