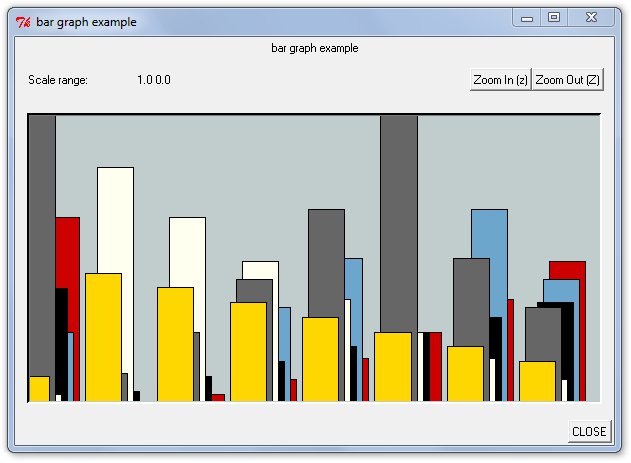
The BarGraph class creates a Tk window to display a bar graph that can be modified dynamically, while a simulation runs.
Here you see an example with 8 data sets and 6 bars per data set:
The most useful methods of the class are summarized in below table.
|
Method |
Parameter |
Description |
|---|---|---|
|
int setup (...) |
|
start a fresh plot; return FALSE if setup fails |
|
|
Block* parent |
pointer to the block using the class |
|
|
char* desc |
label for the bar graph |
|
|
int numInputs |
the number of data sets to plot |
|
|
int numBars |
the number of bars per data set to show at once |
|
|
double top |
the numerical value that will produce the highest bar |
|
|
double bottom |
the numerical value that will produce the lowest bar |
|
|
char* geometry |
the starting position for the window (e.g. +0+0 or -0-0) |
|
|
double width |
the starting width of the window (in cm) |
|
|
double height |
the starting height of the window (in cm) |
|
int update (...) |
|
modify or add a bar; return FALSE if it fails |
|
|
int dataSet |
the number of the data set (starting with 0) |
|
|
int bar |
the horizontal position of the point to plot |
|
|
double y |
the requested height of the bar |